We are pleased to present this detailed report on the updates and improvements included in version 5.5.2 of our software. In this latest update, our development team has worked to deliver a set of advanced features that will elevate efficiency, productivity, and user experience.
Since the previous version, we have taken into account the comments and suggestions from our user community, and the result is a version that meets current market demands and anticipates future needs. With the goal of optimizing the effectiveness of your tasks and providing a more intuitive and personalized approach, we have integrated features that mark a turning point in the evolution of our software.
In this report, we will delve into each of the new features you will find in version 5.5.2, detailing their benefits and how they can be leveraged.
Description of the New Application Interface.
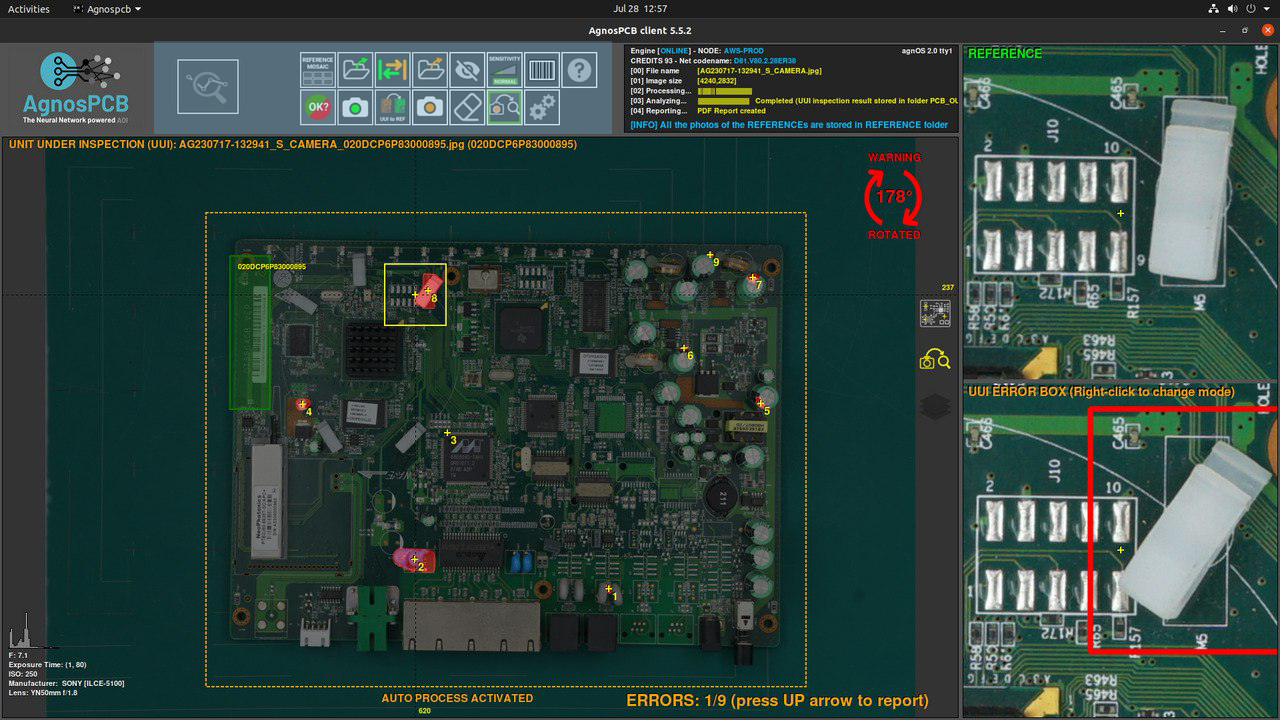
In the application, the main screen has been designed to provide a more intuitive and functional experience.
The main screen is divided into four parts:
Description of the Top Options Menu Buttons.
In this section, we will give you a detailed explanation of each of the buttons that make up the top options menu in our application.
Reference mosaic
This functionality will allow you to store up to 24 references for quick access. Once you click on the “Reference Mosaic” button, a popup will open where you can store your references. You will have the option to manually add a reference using your mouse in one of the empty slots.
For added convenience, we have also incorporated the option to use the F1 to F8 function buttons to quick load references directly in the F1 to F8 slots. You only need to press the corresponding function button while working, and it will be automatically loaded.
On the other hand, within the tile where the references are stored, the date of the day on which each reference was stored will be automatically recorded and displayed.
Open reference
Once you click the “Open Reference” button, a pop-up window will open allowing you to browse and select the file containing the reference PCBA you wish to use in the inspection. You can browse through your directories (by default /REFERENCES subfolder) to find the appropriate file, and then select it.
Open UUI
By clicking on the “Open UUI -Unit under inspection” button, a pop-up window will open allowing you to browse and select the file containing the input image with the board to be analysed. You will be able to browse your directories and folders to find the appropriate image and load it into the application.
Once the input image is loaded, our inspection tool will automatically process the image, identifying any errors present on the PCBA. Errors, if any, will be clearly displayed on the interface, highlighting problem areas in red for quick and easy identification.
Draw exclusion area
When you click on the “Draw an Exclusion Area” button, you can draw an exclusion area directly on the reference PCBA using the mouse (left button + drag). Once the area is drawn, our system will automatically recognise that area as a “non-inspection zone”
This functionality is especially useful when you have elements on the reference PCBA that could be mistaken for errors or when you want to avoid detection of certain specific areas for a particular reason.
Sensitivity
The “Sensitivity Button”, which allows you to adjust the susceptibility of the input board error detection to your specific needs. Clicking the sensitivity button will change the sensitivity level depending on the number of times you press it:


This functionality allows to adapt the error analysis according to the sensitivity needs required in the manufacturing process for each batch of PCBAs.
Barcode
Allows the area where the barcode label is located to be marked on the input PCBA.
Once you have marked the barcode label, the application will use this information in the analysis and inspection process as well as in the inspection report, allowing you to identify the PCBA and use the barcode more efficiently.
Take reference photo
“Take Reference” allows you to easily capture a photo of the reference PCBA using your platform’s camera.
When you click the “Take Reference” button, the camera will automatically activate, and you will be able to take a perfect photo of the REFERENCE PCBA.
Once you have taken the photo, the image of the reference PCBA will be automatically loaded into the application (and optionally stored in MOSAIC´s slot).
This “Take Reference” functionality will significantly simplify the process of capturing the reference PCBA, as it will allow you to directly use your platform’s camera to obtain a sharp and high quality image.
Take UUI -Unit Under Inspection
It will allow you to capture a photo of the input PCBA and immediately perform inspection to detect and display possible errors present on the PCBA.
When you clink on the “Take UUI” button, the camera will take perfect photo of the UU. Once you have captured the image, our inspection system will automatically analyse the PCBA, detecting and highlighting any errors found in real time.
Detected errors will be clearly displayed on the interface, marked in red for quick identification. In this way, you will be able to review input PCBA errors almost instantly, making correction easier and allowing for greater agility in your processes.
Swap Workspace
We have added a handy feature called “Swap Workspace”, which will allow you to quickly and easily switch between displaying the reference board and the input (UUI) board.
You can access the Swap Workspace in two ways:
UUI to reference
“UUI to Reference” allows you to swap the roles of the input board and the reference board after you have performed the inspection.
Once you have performed the inspection and not detected real faults on the input board, selecting the “UUI to Reference” button will make the input board the new REFERENCE board. This will allow you to perform further inspections and comparisons based on the original input board, which has now become the current REFERENCE.
This change gives you the possibility to use the input PCBAas a reference point for future inspections and optimises your workflow by not having to reload a new reference PCBA.
Remove exclusion Area
Allows you to easily remove previously drawn exclusion areas with the “Draw Exclusion Area” button.
Auto process On
“Autoprocess On” feature allows you to enable automatic inspection processing when loading the input image. By default, this option is enabled.
Clicking the “Autoprocess On” button will activate this feature, which means that every time you load a new input image, the application will automatically perform inspection and detect errors present on the board.
Start Inspections Process
Once you have deactivated the “Autoprocess On” function, you can use the “Start Inspections Process” button to manually start the analysis and detection of errors on the input board.
When you select the “Start Inspections Process” button, the application will perform the inspection and detect possible errors present on the input board. The errors will be highlighted on the interface, allowing you to review them and take the necessary actions to correct them.
Help
By clicking on the “Help” button, the application will automatically open the default web browser on your device and redirect you to the AGNOSPCB help page. Here you will find a wide variety of useful resources, such as user guides and tutorials, which will provide you with comprehensive support to use our application optimally.
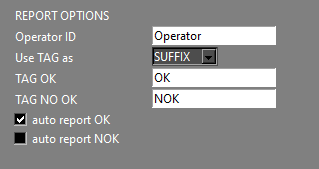
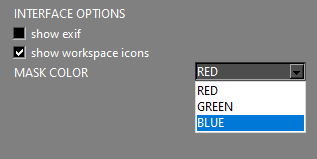
Settings
We have added a complete feature that allows you to customise the settings via the “Settings” button. Clicking it will open a pop-up window divided into five sections:
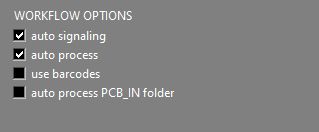
AUTO PROCESS PCB_IN folder will let the system to use ANY image of an UUI stored inside the /PCB_IN folder no matter it source. This is useful if you want to use your own optical system to capture the images of the UUI PCBAs.
The suffix or Preffix word (by default OK or NOK for a “no faulty PCBA” or “faulty PCBA”) will appear after or before the name of the inspection result image and PDF report.
Auto Report OK (if enabled) will make the software to create a PDF report automatically if there are no faults present on the inspected PCBA.
Auto Report NOK (if enabled) will make the software to create a PDF report automatically even if there are faults present on the inspected PCBA. But the faults will not be listed as they were reviewed by an operator.
Finish inspection PDF REPORT CREATION
Allows you to save the inspection report with additional options to classify the result.
When you click on the “Finish Inspection” button, a pop-up window will open where you can enter the name of your choice for the report. Here you will find two buttons to select whether the report is positive or negative, depending on the results of the inspection.
In addition, within the pop-up window, you will find a text box (observations) where you can enter remarks pertaining to the report. This space will allow you to provide additional details on the results obtained during the inspection.
Once you have completed the required information, you can save the report. By default it will be stored inside the /PCB_OUT folder.
KEYBOARD SHORTCUTS
We have incorporated an intuitive feature that allows you to navigate through the various errors detected on the board after inspection using the left and right buttons on the keyboard.
Up / down arrow keys:
After you have made the inspection and detected the errors on the input board, you can use the right arrow keys ▶️ and left ◀️ on your keyboard to move through the detected errors one by one.
While you are viewing a specific error on the PCBA, you can use the up-arrow keys 🔼 or downwards 🔽 to perform the error classification:
R key:
Pressing the “R” key on the keyboard captures a photo with the camera, similar to the physical button on the inspection platform or the icon available in the “Take a Reference” interface.
S key:
Pressing the “S” key on the keypad captures a “Unit Under Inspection” (UUI) photo, similar to the physical button on the inspection platform or the icon available in the “Take a UUI” interface.
1-2-3 keys:
By using the 1, 2, and 3 keys, you can easily adjust the sensitivity according to your specific inspection requirements, ensuring a flexible and precise error detection process.
F1 to F8 keys:
For added convenience, we have also incorporated the option to use the function keys F1 to F8 to directly store references in the corresponding F1 to F8 cells within the reference mosaic. You simply need to press the appropriate function key while viewing the desired reference, and it will be automatically stored in the selected cell.
TAB key:
Will allow you to swap between REFERENCE and UUI images quickly